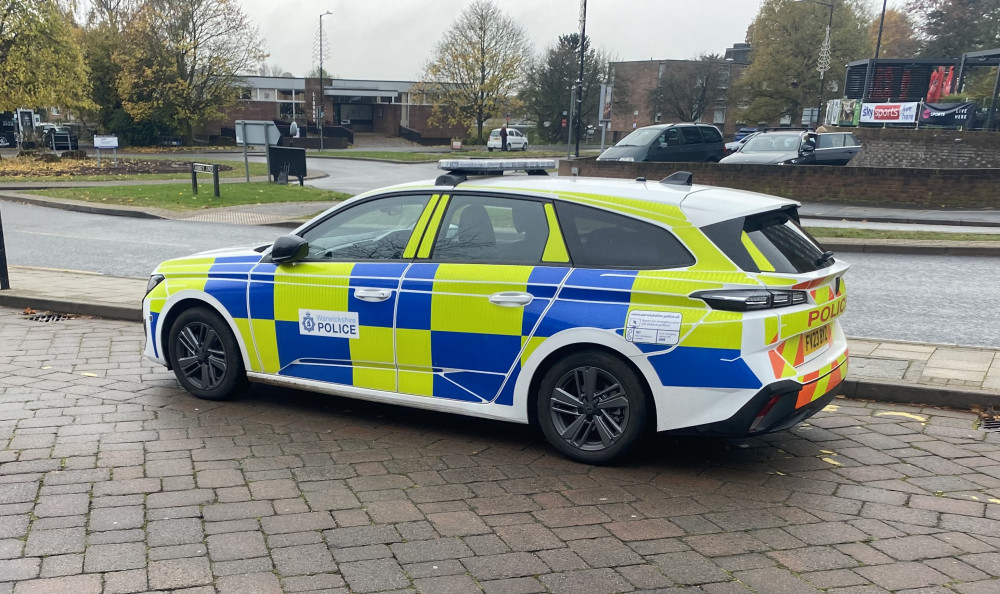
Interactive map shows crime hotspots in Kenilworth and Warwickshire from latest police data
By James Smith 20th Jul 2024
By James Smith 20th Jul 2024

An interactive map, created by Nub News, shows where crimes have been reported around Kenilworth.
Using Police.uk data the map shows all the crimes reported to Warwickshire Police during May 2024 - the most recent data to be released.
Each spot on the map shows where a crime has been reported, the nature of the crime and the last recorded outcome.
During May 2024 the following crimes were recorded to Kenilworth police:
- Violence and sexual offences 37
- Anti-social behaviour 24
- Other theft 13
- Public order 7
- Burglary 8
- Criminal damage and arson 10
- Shoplifting 13
In May 134 crimes were committed - the highest amount for the past 12 months.
CHECK OUT OUR Jobs Section HERE!
kenilworth vacancies updated hourly!
Click here to see more: kenilworth jobs
Share:


