Interactive map shows crime hotspots in Kenilworth from latest police data

By James Smith

28th Dec 2022 | Local News
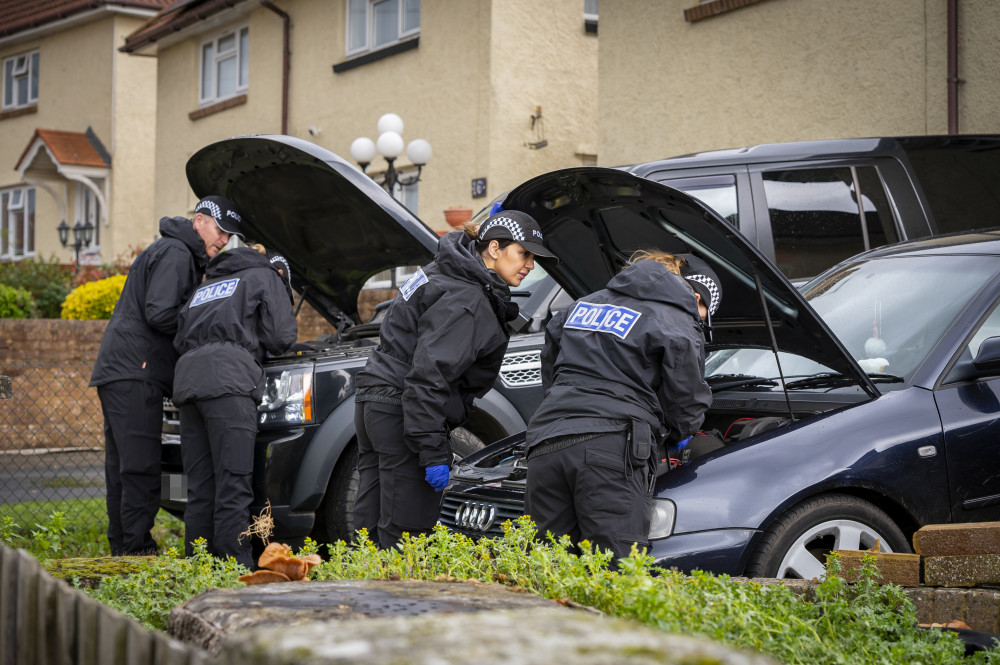
This is where crimes were reported to Warwickshire Police in October 2022 (image via SWNS)

An interactive map, created by Nub News, shows where crimes have been reported around Kenilworth.

Using Police.uk data the map shows all the crimes reported to Warwickshire Police during September 2022 - the most recent data to be released.

Each spot on the map shows where a crime has been reported, the nature of the crime and the last recorded outcome.

During October 2022 the following crimes were recorded to Kenilworth police:

  • Violence and sexual offences 33
  • Anti-social behaviour 28
  • Vehicle crime 16
  • Other theft 15
  • Public order 12
  • Burglary 9
  • Criminal damage and arson 6
  • Shoplifting 3
  • Other crime 3

In September 126 crimes were reported in the town the most that has been reported in the past 12 months.


New kenilworth Jobs Section Launched!!
Vacancies updated hourly!!
Click here: kenilworth jobs

Share:

Related Articles

Lidl wanted to build a new supermarket on the eastern side of Kenilworth Road (image via Lidl)
Local News

Plans for new Lidl supermarket refused over impact on green belt

Kenilworth Town Council wants to improve pedestrian access to Kenilworth Castle (image by Richard Smith)
Local News

£25k spend agreed as council presses forward with possible pedestrian crossing to Kenilworth Castle

Sign-Up for our FREE Newsletter

We want to provide kenilworth with more and more clickbait-free local news.
To do that, we need a loyal newsletter following.
Help us survive and sign up to our FREE weekly newsletter.

Already subscribed? Thank you. Just press X or click here.
We won't pass your details on to anyone else.
By clicking the Subscribe button you agree to our Privacy Policy.